Ethan Wilson
Data Scientist & Analyst | M.S. University of Florida
(954) 856-9486 | ethmwn@gmail.com
EXPERIENCE

Data Science & Machine Learning Intern | Aroapp.ai
Miami, FL | July 2025 – Dec 2025
Developed an end-to-end MLOps pipeline that transforms raw restaurant partner data into local and trend aware event recommendations for over 500+ Miami restaurant clients, reducing manual ideation time by 60%. The engine uses LLM-driven enrichment, unsupervised clustering, and a human feedback loop to generate, score, and refine event recommendations.
- Data Enrichment: Used GPT-4-turbo along with structured JSONs to enrich raw restaurant profiles with 10 standardized fields (ambience, cuisine, guest profile, press mentions, etc.) using data from Eater Miami, Michelin Guide, and Google Business.
- Feature Engineering & Clustering: Utilized TF-IDF for keyword importance and sentence-transformers for semantic similarity to encode across 600+ features, then reduced to 387 components via PCA. Optimized K-Means clustering to K=4 archetypes using silhouette score analysis, creating 4 well separated and unique restaurant segments.
- LLM Event Generation: Built a two-stage GPT-4-turbo pipeline that first researches current trends within the Miami area for each archetype, then generates 4-5 unique and feasible event ideas with titles, strategies, timing, and trend references.
- Reviewer Model & Feedback Loop: Tuned a DistilBERT classifier on team feedback (1-5 star ratings on the event ideas mapped to poor/neutral/good) to score and filter the LLM-generated recommendations. The feedback loop consists of automated feedback collection via Mailgun HTML emails which routes the team's feedback back into the reviewer model's training pipeline for continuous quality improvement.

Sales Operations Analyst Intern | Dexian
Orlando, FL | May 2024 – June 2024
A sales operations internship within a Dexian staffing and recruiting office where I supported a 12-person sales team by extracting insights from raw Bullhorn CRM/ATS data to track recruiter performance, identify workflow inefficiencies, and report pipeline bottlenecks.
- Engineered SQL queries from Bullhorn's raw CRM/ATS data to extract recruiter activity, candidate pipeline stages, and submission to placement conversion rates, identifying bottlenecks within the candidate qualification process.
- Designed and deployed interactive Tableau dashboards for the 12-person sales team, allowing for real-time tracking of KPIs including daily spread, fill rates, and lead time.
- Modeled historical recruitment data using Python (Pandas) and Excel to translate raw CRM data into actionable recommendations for a final presentation to executive leadership.

Scholar-Athlete, Defensive Back | Florida Gators Football
Gainesville, FL | August 2023 – January 2025
Participated as a Division I Student-Athlete at the University of Florida as a defensive back while also working a part-time job and completing a full-time STEM graduate program. Developed the discipline, coachability, high work ethic required to manage both athletic and academic demands simultaneously.
- Competed as a defensive back in the SEC while managing a 25+ hour weekly D1 athletic schedule of practice, film study, and conditioning year-round.
- Maintained a full-time graduate workload in Data Science with a 3.5 GPA while also completing an internship and 20+ hours of professional development annually.
- Contributed 10+ hours a month providing volunteer service to the Gainesville community, including tutoring and mentoring children at local elementary schools and participating in home building programs.

Lead Student Housing Leasing Agent | Landmark Properties Inc.
Gainesville, FL | August 2021 – December 2025
A four year tenure as a Lead Leasing agent across three Landmark Properties student housing communities in Gainesville, FL including an essential role in helping launch a brand new property from scratch. Balanced a high-volume sales and customer service role with full-time undergraduate and graduate coursework along with D1 athletics.
- Served as the first point of contact for over 4400+ residents over four years guiding tours, managing the full leasing pipeline from initial contact to signed lease, and performing daily follow-up via phone and text to maintain pipeline momentum.
- Led and mentored a team of 5-6 leasing agents across daily operations, training staff on communication etiquette, prospect techniques, and tour delivery.
- Temporarily deployed to the largest Landmark property in Gainesville with over 1600 residents to support their annual unit turnover due to demonstrated ability. Worked 60+ hour weeks to help coordinate apartment cleaning, maintenance, and move-in workflows.
- Implemented automated communication workflows that reduced prospect response time by 12%, essentially streamlining front desk communications allowing for more time to be spent on people facing tasks.
PROJECTS
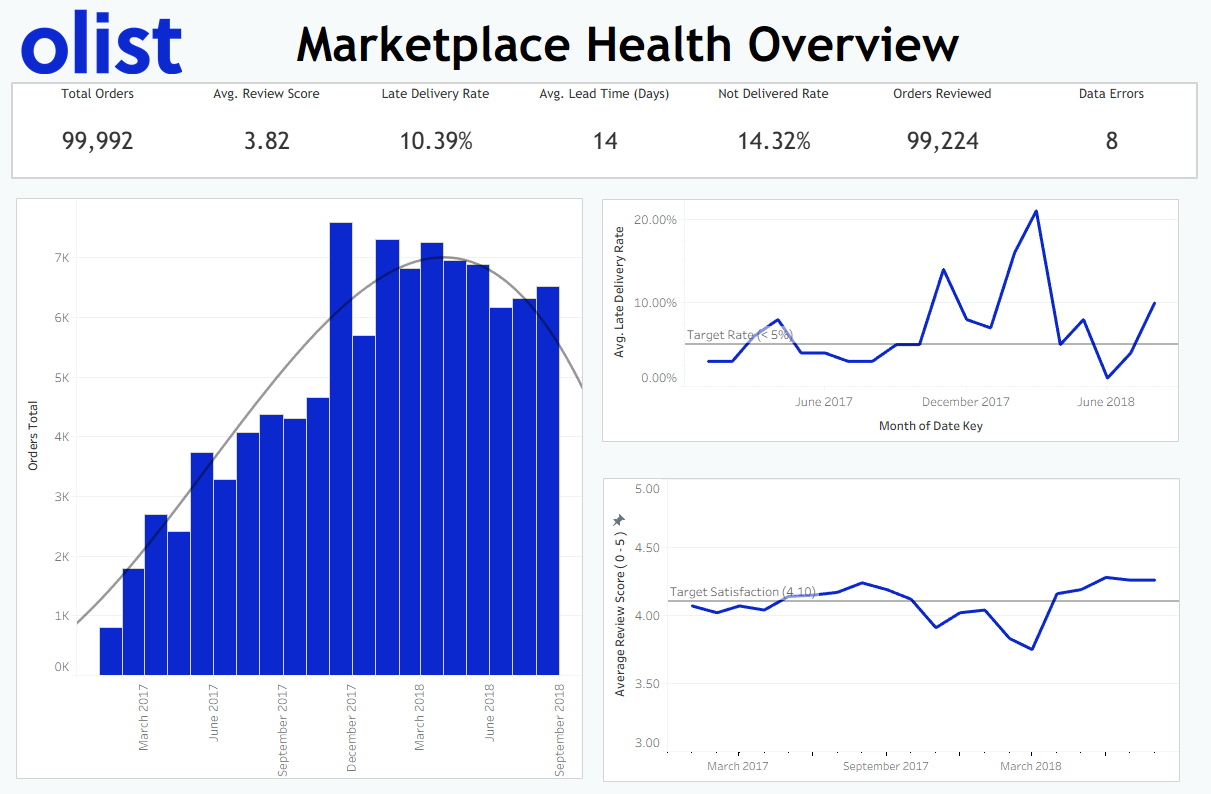
 Olist E-Commerce Health & Analytics
SQL, Tableau, Python, AWS (S3, RDS)
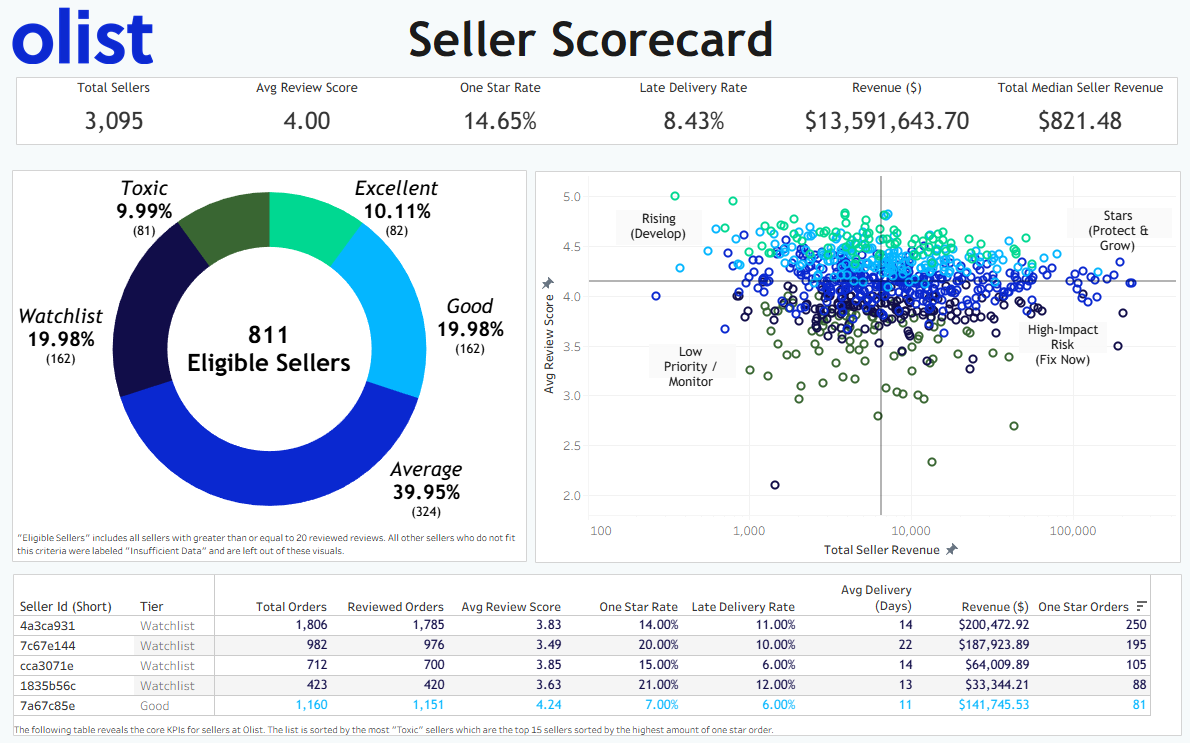
An end-to-end data ELT analytics pipeline (AWS S3 Bucket -> RDS PostgreSQL Database -> Tableau) whose goal is to track marketplace KPIs, track individual seller KPIs, and develop visualizations in order to assess marketplace health and improve customer retention. The project produces a cleaned analytics layer as well as a "Seller Scorecard" to help identify under-performing sellers.
- Pipeline & Modeling: Ingested raw CSVs from an S3 bucket (via Python script) into a staging schema in PostgreSQL, then built a standardized cleaning schema. The data was then curated for an analysis layer where it was made ready for Tableau.
- Feature Engineering: The pipeline derives fulfillment KPIs such as delivery_lead_time, days_late, is_late_delivery, and delivery_check to quantify both seller reliability and data quality.
- Seller KPIs: Built a seller KPI view (analysis.seller_kpis) to avoid item-level duplication and calculate review quality, 1-star rate, and late delivery rate per seller.
- Marketplace Monitoring: Created a monthly marketplace health time series view (analysis.marketplace_health_monthly) which tracks orders, review score, late delivery rate, not delivered rate, and data errors.
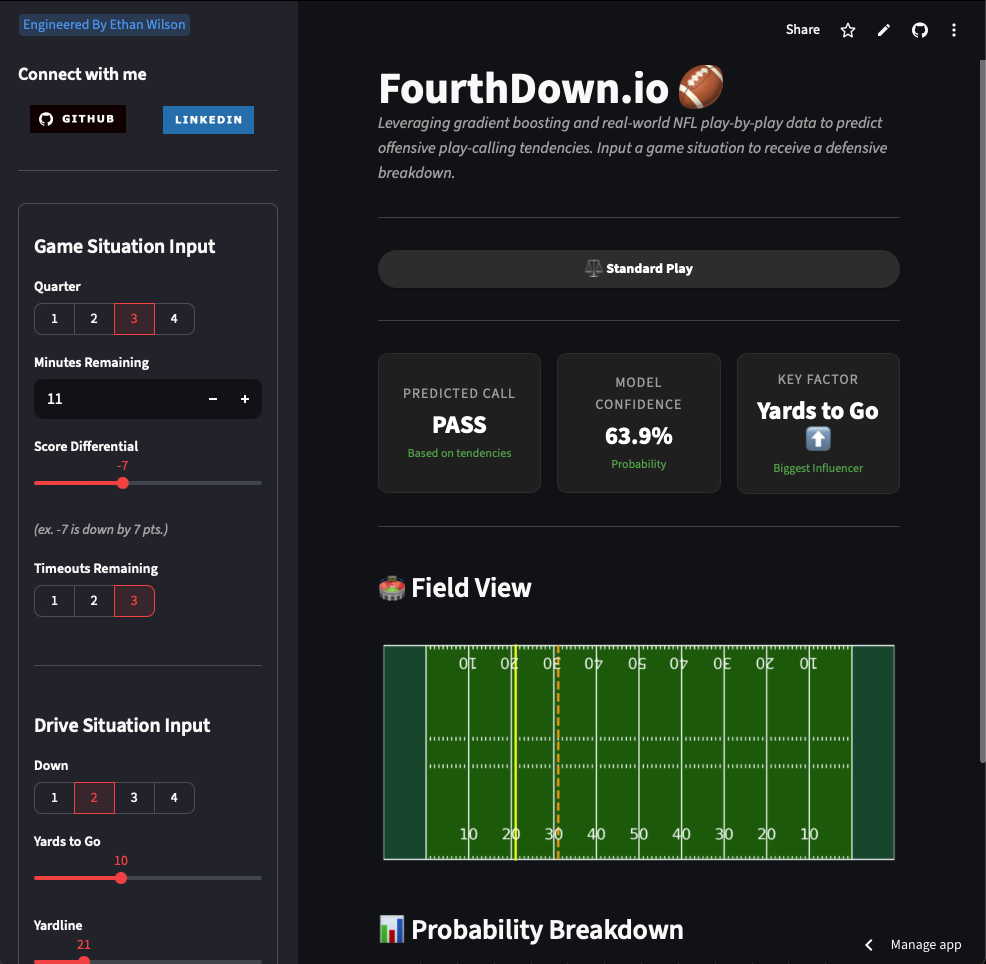
NFL Run/Pass Prediction Engine ("Virtual Defensive Coordinator")
Python, LightGBM, Streamlit
Click here for the FourthDown.io Web App
Developed a machine learning pipeline that predicts NFL offensive play-calling decisions by using historical play-by-play data. The project includes building end-to-end data infrastructure, from extracting and preprocessing real-time game situations to training multiple LightGBM classification models for various situations. The engine takes in factors such as down, distance, field position, and game dynamics to develop probability distributions for play-calling outcomes and uses SHAP to provide interpretable insights.
- Data Pipeline: Automated data ingestion, cleaning, and feature engineering for 15+ years of NFL play-by-play data with special handling of garbage time scenarios.
- Dual Predictive Models: Separate predictive models for regular play-calling (Run/Pass) and 4th down decisions (Go/Kick). Both used LightGBM with time-series validation.
- SHAP: Integrated Shapley values to provide explainable predictions which reveals feature importance and decision thresholds for coaching strategies.
- Model Accuracy: The cascade model was able to predict offensive play-calling and 4th down decisions with 70% accuracy.
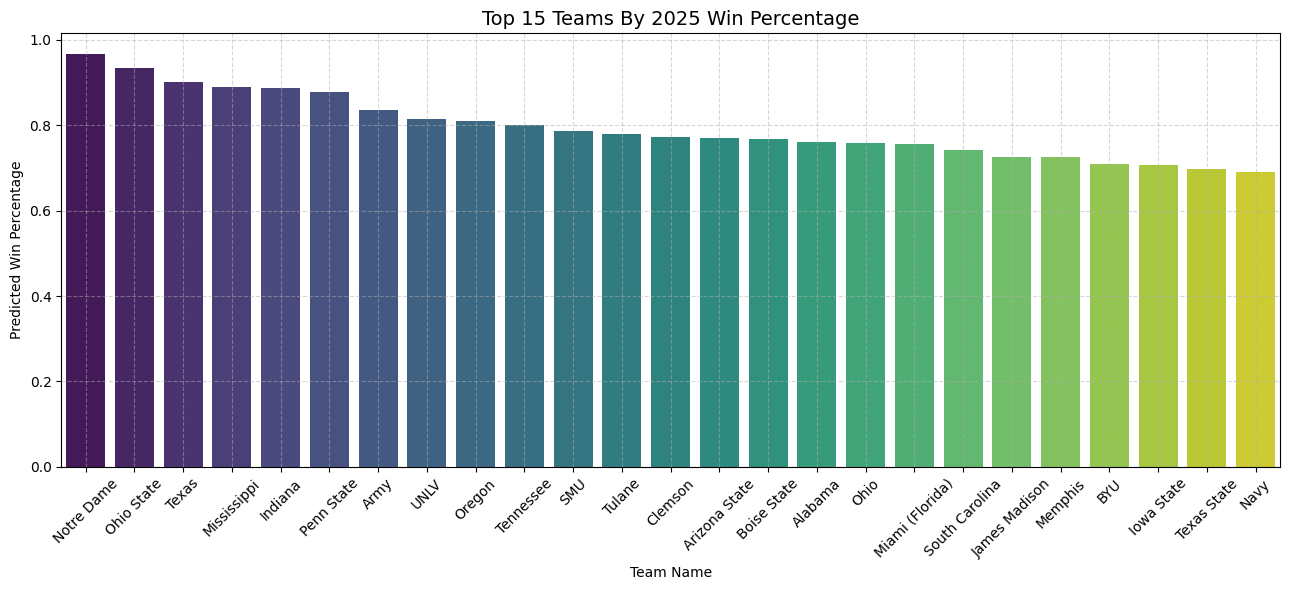
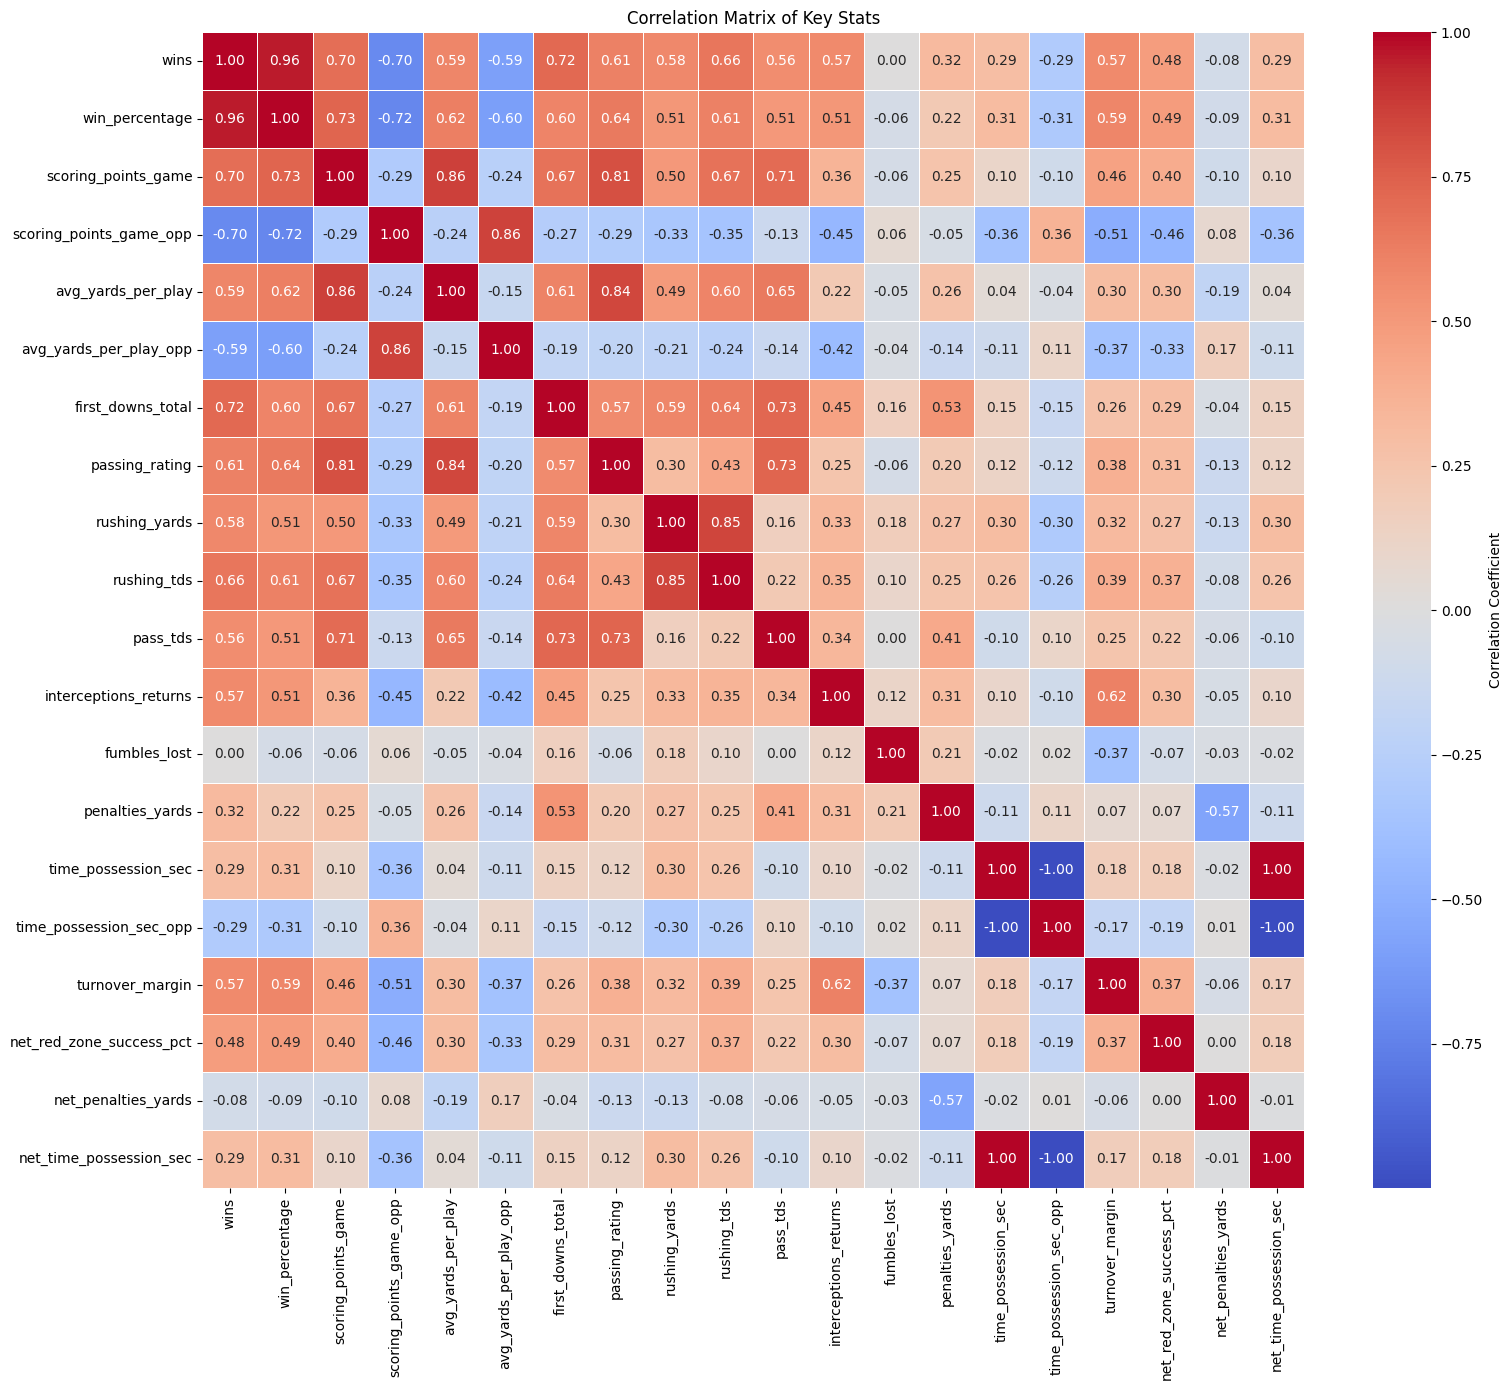
Predicting CFB Wins
Python, Scikit-Learn, BeautifulSoup, LightGBM, Requests
An end-to-end machine learning pipeline which predicts NCAA Division I Football team win percentages based on historical performance data. The project contains web scraping, feature engineering, exploratory analysis, and various modeling techniques to identify which team statistics correlate the most with winning seasons. The pipeline utilizes 1,000+ historical records from 2016-2024, combining data ingestion, data cleaning, and predictive modeling to generate forecasts for the 2025 season. Key Features:
- Custom Web Scraper: Built a custom web scraper using BeautifulSoup & Requests to scrape 9 years of team statistics and records from cfbstats.com, extracting 50+ raw metrics.
- Feature Engineering & EDA: Derived metrics such as win percentage, turnover margin, and net scoring differential to conduct a correlation analysis via Pandas and Seaborn.
- Multiple Predictive Models: Developed and compared five regression models (Linear, Ridge, Random Forest, LightGBM, SVR) with hyperparameter tuning via GridSearchCV and RandomizedSearchCV to optimize model performance on the 2024 test data.
- Robust Data Pipeline: Implemented thorough data cleaning with standardized transformations, compound field parsing, and missing value imputations while also excluding 2020 season data due to COVID related anomalies.
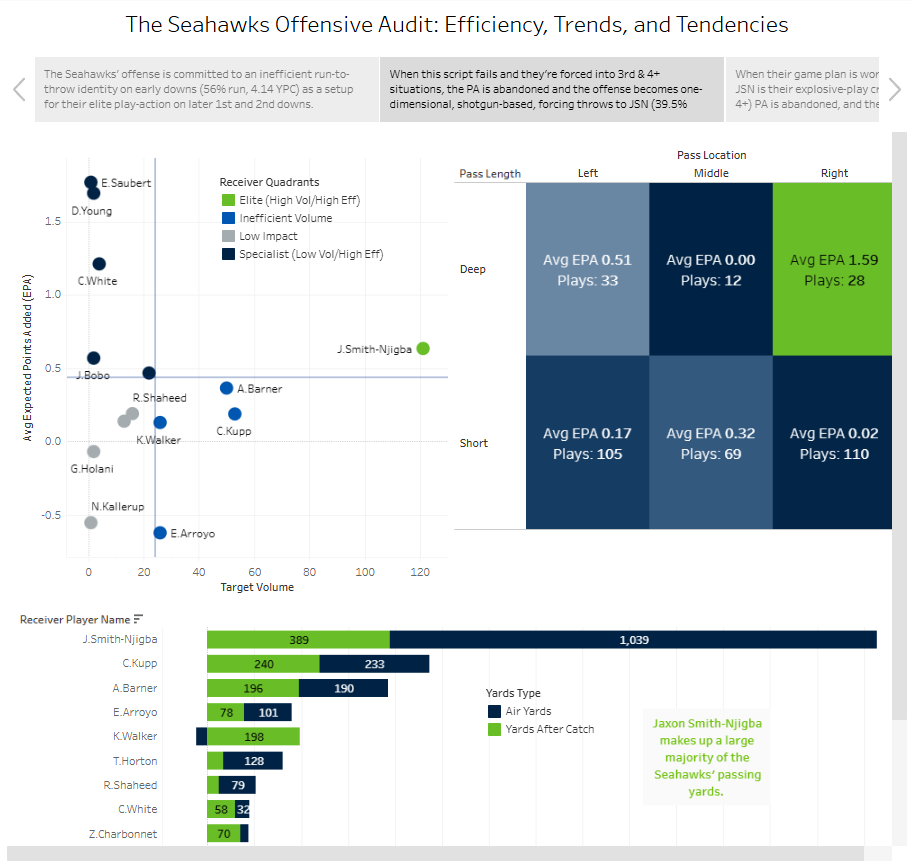
Seahawks Offensive Analysis
Python, Pandas, NumPy, Tableau, nflreadpy
A comprehensive data-driven report on the 2025 Seattle Seahawks (Weeks 1-7), uncovering how their offense operates and relies on a run heavy early down identity to later set up their deep-shot play-action passes. The project goes into detail on what happens when that script breaks down and also how their star WR J. Smith-Njigba fits into their scheme.
- Play-Action Analysis: Identified that the Seahawks' play-action passes generate 0.57 EPA/play vs 0.05 EPA/play on standard dropbacks which reveals an 11.5x efficiency gap.
- Cardinals Case Study: Analyzed the Week 4 Arizona Cardinals game to extract defensive strategies that helped neutralize the Seahawks' offense, reducing PA effectiveness from 0.57 to -0.02 EPA by bracketing JSN and an 83% blitz rate.
- Visualizations: Exported the cleaned play-by-play data to Tableau in order to build an interactive storyboard dashboard summarizing both offensive tendencies and player performance.
EDUCATION
University of Florida — Gainesville, FL
M.S., Information Systems & Operations Management (Data Science) — Dec 2025
- Key Focuses: data analysis, machine learning, analytics, data engineering/MLOps, statistics
- GPA: 3.5
B.A., Business Administration & Computer Information Science — May 2024
- Minor: Computer Information Science & Engineering
- Clubs: Black Students in Business, Software Engineering Club, University Athletics

📖 ABOUT ME
I am a Master’s graduate in Information Systems & Operations Management (Data Science focus) with an interest in extracting insights from raw, messy data. My interest in the field stems from my undergraduate work in Computer Science, where I discovered my passion for building computer programs. The ability to sit down for a couple hours and bring something into the world that didn’t exist before completely captured me. However, after spending several years in collegiate athletics witnessing the impact data had on the outcome of competitions, my passion evolved into something new. And now here I am, on an expedition to see how far I can push myself.
In my free time I love to fish, spend time with friends and family, and of course watch sports. Feel free to reach out to me below.
📬 CONTACT
- Email: ethmwn@gmail.com
- Mobile Phone: (954)-856-9486